Product Graph Navigation Zone
1. Purpose
The Product Graph Navigation Zone is the PVEP zone through which consumers, organizations, applications, agents, and products-as-consumers explore relationships across the ProductVerse.
It makes the ProductVerse visible as a connected topology rather than a flat catalog of isolated products.
Products do not exist only as standalone listings. A product may depend on other products, produce value for downstream products, substitute for another product, complement another product, participate in bundles, expose output ports, carry trust evidence, enforce policies, and contribute to wider product ecosystems.
The Product Graph Navigation Zone helps consumers answer questions such as:
- What products are related to this product?
- What does this product depend on?
- Which products consume this product?
- What products are suitable substitutes?
- What products are useful complements?
- What products are commonly bundled together?
- What policies, entitlements, or trust signals affect this product?
- What product chains or value flows does this product participate in?
- What downstream impact would occur if this product changed, failed, degraded, or was retired?
2. Definition
The Product Graph Navigation Zone is the PVEP capability zone that enables exploration, visualization, filtering, interpretation, and traversal of product relationships and ProductVerse topologies.
It provides experience-level access to product relationship data, product graph projections, dependencies, lineage, provenance, substitutes, complements, product chains, product constellations, product ecosystems, policy relationships, entitlement relationships, trust relationships, and product-to-product consumption patterns.
The key principle is:
The Product Graph Navigation Zone makes product relationships visible, navigable, and actionable without becoming the authoritative product relationship registry itself.
3. Scope
The Product Graph Navigation Zone covers:
- product relationship exploration,
- product graph visualization,
- product dependency navigation,
- upstream and downstream lineage,
- provenance exploration,
- substitute discovery,
- complement discovery,
- product bundle exploration,
- product chain and flow exploration,
- product ecosystem views,
- product constellation views,
- provider network views,
- policy relationship navigation,
- entitlement relationship navigation,
- trust relationship navigation,
- DPP relationship navigation,
- product-to-agent relationship navigation,
- product-to-marketplace relationship navigation,
- impact analysis,
- topology projection selection,
- graph-based recommendations,
- product relationship explanation,
- graph-based handoffs to marketplace, trust, consumption, portfolio, product selection, or PDEP.
The zone does not own:
- authoritative creation of product relationship records,
- product lifecycle management,
- product composition,
- product creation,
- product validation,
- product publication,
- governance decisioning,
- entitlement authority,
- product runtime execution.
Those responsibilities belong to product registries, relationship registries, lineage systems, PDEP, Governance Kernel, entitlement services, and runtime capabilities.
4. Position within PVEP
The Product Graph Navigation Zone is one of the seven PVEP experience zones.
ProductVerse Experience Plane (PVEP)
├─ Marketplace Experience Zone
├─ Consumption Experience Zone
│  └─ Consumer Experience Plane (CEP)
├─ Concierge & Agent-Mediated Discovery Zone
├─ Product Graph Navigation Zone
├─ Portfolio & Entitlement Experience Zone
├─ Product Select & Assembly Zone
└─ Governance & Trust Experience Zone
It interacts with every other PVEP zone because product relationships influence discovery, evaluation, consumption, entitlement, trust, selection, and transition to PDEP.
| Related PVEP Zone | Relationship |
|---|---|
| Marketplace Experience Zone | Product detail pages may link to graph views showing related products, substitutes, complements, bundles, and dependencies. |
| Consumption Experience Zone | Consumption experiences may expose upstream lineage, downstream usage, related output ports, or dependency context. |
| Concierge & Agent-Mediated Discovery Zone | Agent-mediated discovery may use graph relationships to recommend products, substitutes, complements, or product sets. |
| Portfolio & Entitlement Experience Zone | Portfolio views may show product holdings, entitlements, subscriptions, and dependencies as graph relationships. |
| Product Select & Assembly Zone | Graph navigation may feed selected products, product sets, candidate bundles, or PDEP transition packages. |
| Governance & Trust Experience Zone | Trust, policy, risk, evidence, and DPP relationships may be navigated through graph views. |
| PDEP | Creation or composition intent discovered through graph navigation may transition to PDEP. |
5. Relationship to ProductVerse
The ProductVerse is the expanding universe of productized entities and their relationships, markets, experiences, agents, governance constructs, and recursive value-creation patterns.
The Product Graph is one computable representation of the ProductVerse.
ProductVerse
  ├─ Product Graph
  ├─ Product Web
  ├─ Product Mesh
  ├─ Product Fabric
  ├─ Product Marketplace
  ├─ Product Ecosystem
  ├─ Product Constellation
  ├─ Product Chain
  └─ Product Flow
The Product Graph Navigation Zone provides experience-level access to these different projections.
The zone should not treat the ProductVerse as a single fixed graph. It should support multiple graph projections depending on consumer intent, role, permission, product type, and use case.
For example:
- a consumer may need a substitute graph,
- a steward may need a lineage graph,
- a governance user may need a policy-impact graph,
- an agent may need a machine-readable dependency graph,
- a producer may need downstream-consumer impact views,
- a marketplace user may need related-product suggestions.
6. Why This Zone Exists
Traditional product marketplaces and catalogs tend to present products as isolated entries.
That approach is insufficient in UPOS because products are relational by nature.
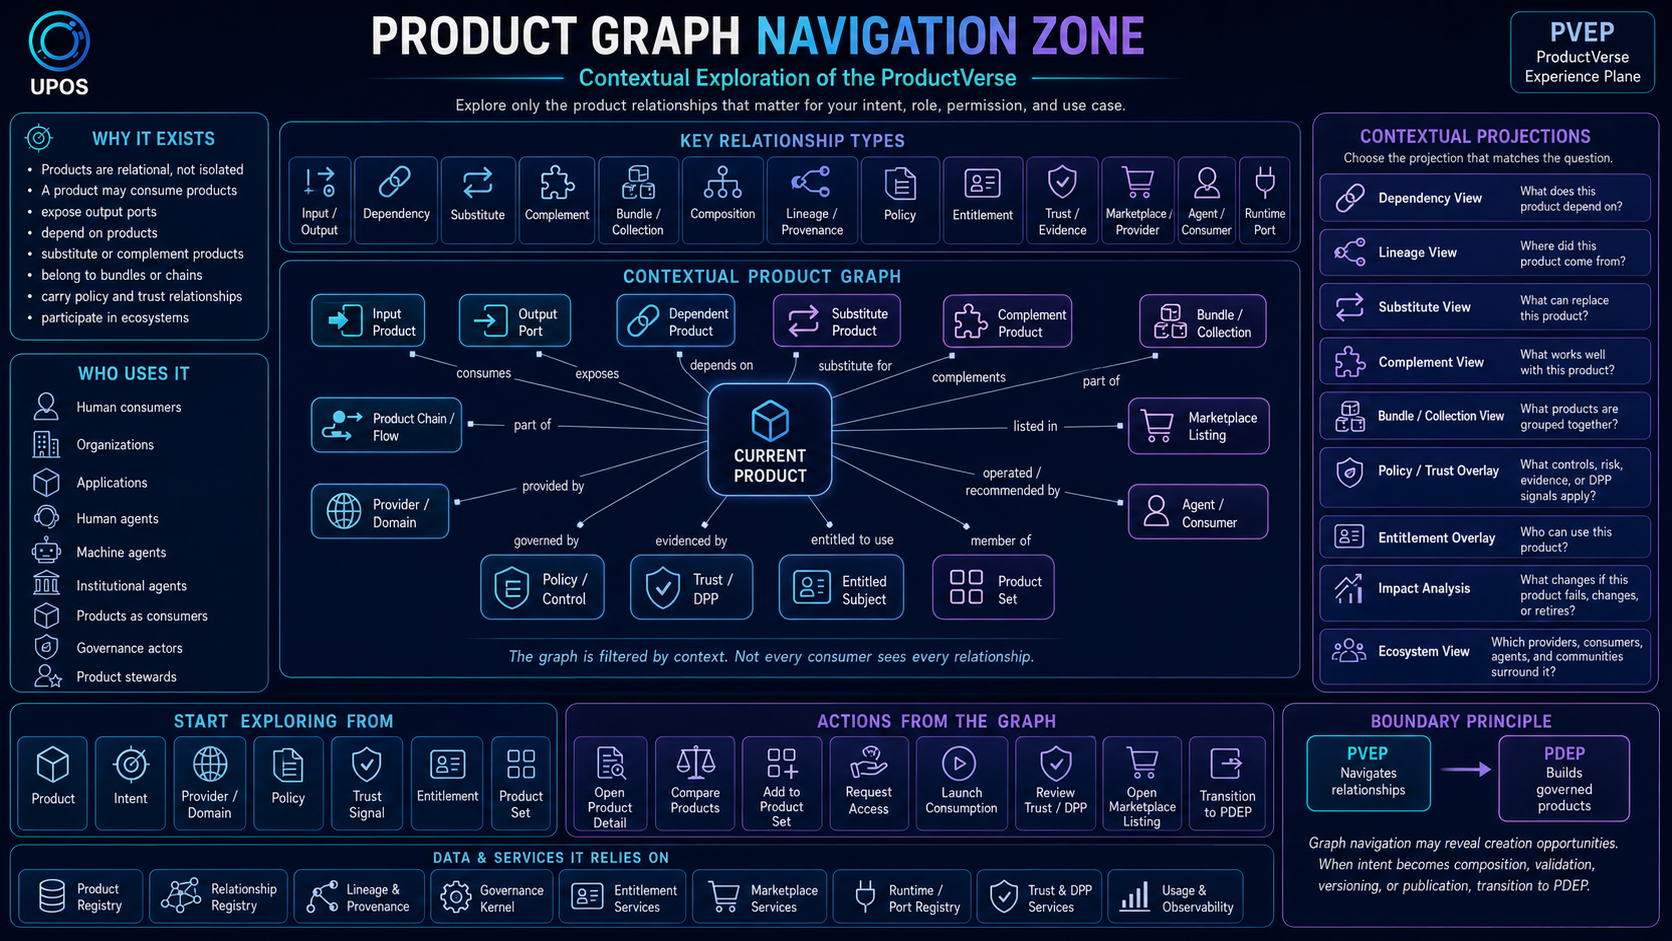
A product can be:
- an input to another product,
- an output of another product,
- a dependency,
- a substitute,
- a complement,
- a bundle component,
- a runtime service,
- a governed asset,
- a licensed object,
- a trust-bearing object,
- a marketplace listing,
- an output-port provider,
- a consumer of other products,
- a participant in product chains and ecosystems.
The Product Graph Navigation Zone exists to reveal these relationships.
It allows consumers and agents to move from:
“What is this product?”
to:
“How does this product relate to the wider ProductVerse?”
7. Core Responsibilities
7.1 Relationship Discovery
The zone helps consumers discover relationships between products.
Relationship discovery may include:
- similar products,
- substitutes,
- complements,
- dependencies,
- upstream inputs,
- downstream consumers,
- products from the same provider,
- products in the same domain,
- products in the same marketplace category,
- products governed by the same policy,
- products using the same output port type,
- products sharing trust or certification posture,
- products commonly consumed together.
7.2 Graph Visualization
The zone may provide visual graph interfaces that show nodes, edges, clusters, paths, flows, and projections.
Graph visualizations may include:
- node-link diagrams,
- tree views,
- radial views,
- dependency maps,
- lineage diagrams,
- value-chain maps,
- ecosystem maps,
- constellation maps,
- bundle diagrams,
- impact maps,
- policy overlay graphs,
- trust overlay graphs,
- entitlement overlay graphs.
Graph visualization should be purposeful. Not every user needs a large graph. Many users may need a focused relationship view.
7.3 Topology Projection
The zone should support different projections of the ProductVerse.
A projection is a filtered, purpose-specific view of product relationships.
Examples include:
- dependency projection,
- lineage projection,
- substitute projection,
- complement projection,
- bundle projection,
- provider projection,
- trust projection,
- entitlement projection,
- marketplace projection,
- ecosystem projection,
- product-chain projection,
- policy-impact projection,
- downstream-consumer projection.
7.4 Impact Analysis
The zone supports understanding the effect of change across product relationships.
Impact analysis may answer:
- What breaks if this product is retired?
- Which downstream products depend on this product?
- Which consumers are affected by a trust downgrade?
- Which product bundles include this product?
- Which AI Products depend on this Data Product?
- Which dashboards consume this product’s output ports?
- Which products are affected by a policy change?
- Which products inherit risk from this product?
7.5 Relationship Explanation
The zone should explain relationships in understandable terms.
Examples:
- “Product B depends on Product A because it consumes Product A’s SQL output port.”
- “Product C is a substitute because it supports the same use case with a lower cost but lower freshness.”
- “Product D is a complement because it is commonly used with this product in regulatory reporting workflows.”
- “This AI Product depends on this Data Product as a training input.”
- “This product has a trust relationship with this DPP because the DPP provides evidence for its claims.”
7.6 Handoff to Other Zones
Graph navigation should support next actions.
Examples include:
- open marketplace listing,
- launch consumption experience,
- request access,
- review trust posture,
- add product to product set,
- compare substitutes,
- inspect DPP,
- view entitlement state,
- initiate PDEP transition.
8. Product Relationship Types
The Product Graph Navigation Zone may expose many relationship types.
8.1 Input Relationship
A product uses another product as an input.
Example:
AI Product
  consumes
Customer Transactions Data Product
8.2 Output Relationship
A product provides an output used by another actor or product.
Example:
Risk Indicators Data Product
  exposes
SQL Output Port
8.3 Dependency Relationship
A product depends on another product for operation, generation, validation, enrichment, or consumption.
Example:
Regulatory Dashboard Product
  depends on
Regulatory Metrics Data Product
8.4 Composition Relationship
A product is composed from one or more products.
Example:
Evidence Package Product
  composed from
Data Product + Policy Product + Report Product
Authoritative composition records should be created through PDEP, not ad hoc graph navigation.
8.5 Substitute Relationship
A product can replace another product for some purposes.
Example:
Product A
  substitute for
Product B
Substitution is contextual. A product may be a substitute for one use case but not another.
8.6 Complement Relationship
A product is useful together with another product.
Example:
Anomaly Detection AI Product
  complements
Payment Events Data Product
8.7 Bundle Relationship
Products are grouped together as a bundle, collection, package, or offering.
Example:
Payment Surveillance Bundle
  includes
Payment Events Data Product
Customer Risk Data Product
Anomaly Detection AI Product
Surveillance Dashboard Product
8.8 Provider Relationship
Products are related through common ownership, stewardship, provider, publisher, or domain.
Example:
Product X
  provided by
Corporate Banking Data Domain
8.9 Entitlement Relationship
A subject has access rights or permissions to a product.
Example:
Team A
  entitled to use
Product Y
8.10 Policy Relationship
A product is governed by a policy, rule, control, or obligation.
Example:
Customer Data Product
  governed by
EU Personal Data Policy
8.11 Trust Relationship
A product is associated with evidence, certification, maturity, risk, quality, or DPP signals.
Example:
AI Product
  has trust evidence
Model Evaluation Evidence Record
8.12 Marketplace Relationship
A product is listed, sold, subscribed to, or distributed through a marketplace.
Example:
Product Z
  listed in
Enterprise Product Marketplace
8.13 Runtime Relationship
A product exposes runtime ports, services, environments, APIs, dashboards, or readers.
Example:
Product A
  exposes
API Output Port
8.14 Agent Relationship
A product is consumed, recommended, governed, managed, or operated by an agent.
Example:
Procurement Agent
  recommends
Approved Product Set
9. ProductVerse Topology Views
The Product Graph Navigation Zone may expose several topology views.
9.1 Product Graph View
A formal node-and-edge representation of products and relationships.
Useful for:
- dependencies,
- composition,
- lineage,
- impact analysis,
- graph traversal,
- machine-readable relationship queries.
9.2 Product Web View
A discoverable, linked-product view where consumers navigate from one product to related products.
Useful for:
- browse-based exploration,
- related product discovery,
- hyperlinked marketplace experiences,
- documentation-style navigation.
9.3 Product Mesh View
A federated ownership and domain-oriented topology of product nodes.
Useful for:
- domain ownership,
- decentralization,
- federated stewardship,
- organizational accountability,
- mesh-style product ecosystems.
9.4 Product Fabric View
A governance, interoperability, integration, and trust-oriented topology.
Useful for:
- policy overlays,
- entitlement overlays,
- trust overlays,
- interoperability views,
- enterprise integration.
9.5 Product Marketplace View
A commercial, organizational, or exchange-oriented projection of products.
Useful for:
- acquisition,
- subscription,
- licensing,
- pricing,
- provider discovery.
9.6 Product Ecosystem View
A socio-economic view of products, providers, consumers, platforms, agents, and governance bodies.
Useful for:
- ecosystem strategy,
- partner analysis,
- platform effects,
- product economy mapping.
9.7 Product Constellation View
A clustered view of products grouped by domain, theme, portfolio, purpose, or community.
Useful for:
- portfolio analysis,
- thematic grouping,
- domain navigation,
- related capability clusters.
9.8 Product Chain / Flow View
A sequential or flow-oriented view of how value moves through products.
Useful for:
- provenance,
- value chain analysis,
- transformation flows,
- production pipelines,
- product-to-product consumption.
10. Graph Navigation Patterns
10.1 Start from a Product
The consumer starts from a known product and explores its relationships.
Example:
Open Product Detail Page
  → View Related Products
  → Open Product Graph Navigation
  → Explore dependencies, substitutes, complements, and trust links
10.2 Start from an Intent
The consumer starts from a need or goal and explores related product clusters.
Example:
Intent: payment surveillance
  → Recommended product constellation
  → Explore product graph
  → Select candidate product set
10.3 Start from a Provider
The consumer explores products provided by a domain, organization, company, team, or steward.
Example:
Corporate Banking Domain
  → Provided Products
  → Product Dependencies
  → Downstream Consumers
10.4 Start from a Policy
The consumer or governance actor explores products governed by a policy.
Example:
EU Personal Data Policy
  → Products Governed
  → Consumers Affected
  → Restricted Output Ports
10.5 Start from a Trust Signal
The consumer explores products that share trust posture, evidence type, certification, risk tier, or DPP state.
Example:
High Maturity Products
  → Certified Products
  → Products with Valid DPP
  → Products Approved for External Sharing
10.6 Start from an Entitlement
The consumer explores products accessible to a person, team, application, agent, or organization.
Example:
Team A Entitlements
  → Accessible Products
  → Product Dependencies
  → Expiring Access
10.7 Start from a Product Set
The consumer explores relationships among selected products.
Example:
Selected Product Set
  → Check dependencies
  → Identify missing complements
  → Review trust posture
  → Prepare transition to PDEP if creation intent emerges
11. Key Artifacts
11.1 Product Relationship View
A consumer-facing view of relevant relationships around a product or product set.
11.2 Product Graph Projection
A filtered graph view designed around a purpose, such as lineage, dependency, trust, entitlement, or substitution.
11.3 Dependency Map
A view of products that a selected product depends on or products that depend on it.
11.4 Lineage View
A view showing origin, transformation, provenance, or value flow across products.
11.5 Impact Analysis View
A view showing downstream effects of a product change, retirement, failure, trust downgrade, or policy change.
11.6 Substitute Set
A set of products that may replace a selected product for a specified purpose.
11.7 Complement Set
A set of products that work well with or are commonly used with a selected product.
11.8 Bundle View
A view showing products grouped into a bundle, package, suite, collection, or composite offering.
11.9 Product Chain View
A sequential view of product-to-product flow, dependency, transformation, or value creation.
11.10 Product Ecosystem View
A broader socio-economic or platform-oriented view of products, providers, consumers, agents, and governance actors.
11.11 Relationship Exploration Signal
A signal emitted when users or agents explore, select, follow, filter, or act on graph relationships.
12. Inputs to the Zone
The Product Graph Navigation Zone relies on multiple underlying sources of truth.
| Input | Description | Likely Authority |
|---|---|---|
| Product metadata | Product identity, type, owner, version, summary, status. | Product Registry / PROD Services |
| Product relationships | Typed relationships between products and other entities. | Product Relationship Registry |
| Lineage and provenance | Origins, transformations, derivations, evidence paths. | Lineage / Provenance Services |
| Output port metadata | Product ports and consumption interfaces. | Port Registry / Runtime Services |
| Trust signals | Quality, maturity, risk, certification, DPP, evidence state. | Governance Kernel / Trust Services |
| Policy relationships | Products governed by policies, obligations, controls, restrictions. | Policy Registry / Governance Kernel |
| Entitlement relationships | Subjects and products connected through access rights. | Entitlement Services / Governance Kernel |
| Marketplace relationships | Listings, categories, providers, subscriptions, commercial status. | Marketplace Services |
| Usage relationships | Co-consumption, downstream usage, popularity, adoption patterns. | Observability / Usage Services |
| Provider relationships | Owners, stewards, domains, publishers, providers. | Provider / Organization Registry |
| PDEP composition records | Governed product composition relationships. | PDEP / Product Registry |
13. Outputs and Signals
The Product Graph Navigation Zone should emit useful events and signals.
Examples include:
- product graph opened,
- product node viewed,
- relationship edge viewed,
- dependency expanded,
- lineage expanded,
- downstream impact viewed,
- substitute viewed,
- complement viewed,
- bundle viewed,
- product chain viewed,
- trust overlay enabled,
- policy overlay enabled,
- entitlement overlay enabled,
- product added to product set,
- product compared from graph,
- marketplace listing opened from graph,
- consumption launched from graph,
- access requested from graph,
- PDEP transition initiated from graph,
- graph query submitted,
- graph export requested,
- relationship feedback submitted.
These signals may feed:
- ProductVerse intelligence,
- recommendation systems,
- marketplace ranking,
- product lifecycle management,
- governance analytics,
- lineage improvement,
- portfolio optimization,
- dependency risk analysis,
- impact assessment,
- producer stewardship dashboards.
14. Relationship to Marketplace Experience Zone
Marketplace experiences often provide entry points into graph navigation.
A product listing may show:
- related products,
- substitutes,
- complements,
- commonly bundled products,
- upstream dependencies,
- downstream consumers,
- same-provider products,
- same-domain products,
- similar products,
- products with similar trust posture.
For deeper exploration, the consumer may open the Product Graph Navigation Zone.
Example:
Marketplace Product Detail Page
  → View Related Products
  → Open Product Graph
  → Explore substitutes, complements, bundles, and dependencies
15. Relationship to Consumption Experience Zone
During consumption, users may need relationship context.
Examples:
- A dashboard user wants to know which data products feed the dashboard.
- An API user wants to know what downstream workflows depend on the API.
- A reader wants to know which asset products are included in a bundle.
- An AI Product consumer wants to know which Data Products support the AI Product.
- A model user wants to know which evaluation products or evidence records support the AI Product.
The Consumption Experience Zone may show compact relationship summaries, while the Product Graph Navigation Zone provides richer exploration.
16. Relationship to Concierge & Agent-Mediated Discovery Zone
Agent-mediated discovery can use graph relationships to produce better recommendations.
Examples:
- recommend substitutes,
- recommend complements,
- identify required dependencies,
- identify product sets,
- detect missing products,
- explain recommendation context,
- avoid products affected by policy or trust issues.
Example:
Consumer intent:
“Find products needed for regulatory evidence generation.”

Agent-mediated discovery:
  → queries Product Graph
  → identifies relevant data, policy, evidence, dashboard, and reporting products
  → recommends candidate product set
The consumer may then open Product Graph Navigation to inspect the recommendation.
17. Relationship to Portfolio & Entitlement Experience Zone
Portfolio and entitlement views can be graph-enhanced.
Examples:
- products accessible to a user,
- products used by a team,
- products nearing entitlement expiry,
- products an agent is authorized to invoke,
- products with denied access,
- products with usage quota relationships,
- products with cost allocation relationships.
Graph navigation can show how a consumer’s products relate to each other and to the broader ProductVerse.
Example:
My Product Portfolio
  → View as Graph
  → Show products I can use
  → Highlight restricted or expiring access
  → Show dependencies and substitutes
18. Relationship to Product Select & Assembly Zone
Graph navigation naturally supports product selection.
A consumer may:
- add a related product to a product set,
- select substitutes for comparison,
- select complements,
- include upstream dependencies,
- add missing products to a candidate solution,
- compare product chain options,
- create a product collection from a constellation.
Example:
Product Graph Navigation
  → Identify relevant products
  → Add to Product Set
  → Product Select & Assembly Zone
  → Review product-set fit
If the consumer intends to create a governed product from the selected set, the flow transitions to PDEP.
19. Relationship to Governance & Trust Experience Zone
Governance and trust relationships are first-class graph dimensions.
The Product Graph Navigation Zone may show:
- products governed by a policy,
- products affected by a regulatory rule,
- products with a valid DPP,
- products with expired evidence,
- products with high or low trust posture,
- products with unresolved exceptions,
- products affected by risk propagation,
- products sharing a control framework,
- products consuming sensitive inputs,
- products with lineage gaps.
The Governance & Trust Experience Zone provides deeper explanation of trust and governance state.
Example:
Product Graph
  → Enable Trust Overlay
  → Identify products with low maturity
  → Open Governance & Trust View
  → Review evidence and policy explanations
20. Relationship to PDEP
The Product Graph Navigation Zone must preserve the boundary with PDEP.
Graph navigation may reveal opportunities or needs for product creation, such as:
- combining products into a new governed product,
- replacing a fragile dependency,
- creating a new derived product,
- packaging related products into a product bundle,
- formalizing a product chain,
- creating a monitoring product for a dependency network.
When intent becomes creation, composition, validation, versioning, or publication, the flow transitions to PDEP.
The key principle is:
Product Graph Navigation may reveal product creation opportunities. PDEP realizes them as governed products.
Example:
Consumer explores product graph
  → Selects multiple related products
  → Identifies opportunity for reusable product
  → Initiates PDEP transition
  → PDEP authors, composes, validates, versions, and publishes product
21. Human and Machine Interfaces
21.1 Human Interfaces
Human-facing graph interfaces may include:
- interactive graph explorer,
- relationship panel,
- related-products carousel,
- lineage viewer,
- dependency map,
- impact analysis view,
- trust overlay map,
- policy overlay map,
- portfolio graph,
- product chain viewer,
- bundle viewer,
- ecosystem map.
21.2 Machine and Agent Interfaces
Machine-facing interfaces may include:
- product relationship API,
- graph query API,
- lineage API,
- dependency API,
- substitute API,
- complement API,
- bundle API,
- trust overlay API,
- policy relationship API,
- entitlement relationship API,
- product chain API,
- graph export API.
These interfaces allow applications, agents, institutional agents, and products-as-consumers to navigate product relationships programmatically.
22. Governance, Quality, and Trust of Graph Data
Graph navigation is only useful if graph data is trustworthy.
Important considerations include:
- authoritative relationship sources,
- relationship provenance,
- relationship confidence,
- relationship type definitions,
- relationship versioning,
- relationship validity period,
- relationship approval state,
- relationship evidence,
- relationship source system,
- automated versus curated relationships,
- consumer feedback on relationship accuracy,
- stale relationship detection,
- policy-controlled relationship visibility,
- sensitive relationship handling.
Some relationships may be derived from usage signals, lineage systems, or recommendation systems. Others may be explicitly declared through PDEP or registries.
The zone should distinguish between:
| Relationship Source | Meaning |
|---|---|
| Declared | Explicitly authored or registered. |
| Derived | Inferred from metadata, usage, lineage, or behavior. |
| Observed | Detected from runtime or consumption signals. |
| Recommended | Suggested by a system or agent but not yet authoritative. |
| Governed | Validated and accepted as an authoritative relationship. |
This distinction matters for trust.
23. Security, Privacy, and Policy Considerations
Product relationships may reveal sensitive information.
The Product Graph Navigation Zone must enforce visibility controls.
Considerations include:
- entitlement-aware graph visibility,
- policy-aware relationship visibility,
- prevention of sensitive dependency leakage,
- restriction of internal product topology exposure,
- access control for lineage and provenance,
- masking of restricted products,
- redaction of sensitive edge labels,
- protection of provider or consumer relationships,
- secure graph APIs,
- audit logging for graph exploration,
- rate limiting for graph traversal APIs,
- purpose-based graph access,
- tenant or domain isolation,
- safe handling of inferred relationships.
A consumer should not be able to infer restricted products or sensitive dependencies through graph navigation.
24. Metrics
Useful metrics include:
- graph views opened,
- product nodes viewed,
- relationships expanded,
- most explored products,
- most explored relationship types,
- substitute views,
- complement views,
- dependency views,
- lineage views,
- impact analysis usage,
- graph-to-marketplace conversion,
- graph-to-consumption conversion,
- graph-to-product-set conversion,
- graph-to-PDEP transition,
- trust overlay usage,
- policy overlay usage,
- entitlement overlay usage,
- relationship feedback volume,
- stale relationship reports,
- graph query success rate,
- graph navigation abandonment.
These metrics help improve ProductVerse intelligence, relationship quality, discovery, and product lifecycle management.
25. Design Guidance
25.1 Avoid Hairball Graphs
Large undifferentiated graphs can overwhelm users. Provide focused projections, filters, clustering, and guided exploration.
25.2 Make Relationships Explainable
Users should understand why a relationship exists, what type it is, who asserted it, whether it is authoritative, and when it was last updated.
25.3 Support Multiple Topologies
Do not assume the ProductVerse has only one graph view. Provide projections for dependencies, trust, policy, lineage, marketplaces, portfolios, ecosystems, and product chains.
25.4 Respect Access Boundaries
Do not reveal restricted products or sensitive relationships through graph traversal.
25.5 Connect Graph to Action
Graph navigation should not be a passive visualization only. It should allow users to open listings, request access, consume products, review trust, add to product sets, or transition to PDEP.
25.6 Distinguish Declared and Inferred Relationships
Users should know whether a relationship is declared, derived, observed, recommended, or governed.
25.7 Preserve the PDEP Boundary
Graph navigation may reveal product creation opportunities, but PDEP builds governed products.
26. Anti-Patterns
26.1 Flat Catalog Thinking
Treating products as isolated catalog entries ignores the ProductVerse reality of relationships, dependencies, value flows, and ecosystems.
26.2 Hairball Visualization
Showing an unfiltered graph with too many nodes and edges creates confusion rather than insight.
26.3 Relationship Without Provenance
Graph relationships without source, confidence, evidence, or freshness are difficult to trust.
26.4 Entitlement-Blind Graphs
Showing restricted products or relationships to unauthorized consumers creates security and compliance risk.
26.5 Trust-Blind Graphs
Showing dependencies without trust, quality, risk, or evidence context can mislead consumers.
26.6 Graph as Product Builder
Using graph navigation to create, compose, validate, version, or publish products collapses the boundary with PDEP.
26.7 Unclear Relationship Semantics
Edges such as “related to” without typed meaning are weak. Relationships should be typed and explainable.
27. Example Journeys
27.1 Related Product Exploration
Consumer opens a marketplace product detail page
  → Clicks “View Product Graph”
  → Explores substitutes and complements
  → Opens a substitute product detail page
  → Compares trust and pricing
  → Adds one product to product set
27.2 Dependency and Impact Analysis
Product steward opens a Data Product graph
  → Views downstream consumers
  → Identifies dashboards and AI Products depending on it
  → Simulates product retirement impact
  → Initiates stewardship action
27.3 Trust Overlay Navigation
Consumer opens Product Graph
  → Enables Trust Overlay
  → Sees maturity and DPP status across related products
  → Opens Governance & Trust Experience
  → Reviews evidence for selected product
27.4 Product Set Creation from Graph
Consumer explores payment surveillance constellation
  → Selects relevant data, AI, policy, and dashboard products
  → Adds them to Product Select & Assembly
  → Reviews product-set fit
  → Transitions to PDEP if creation intent emerges
27.5 Product-to-Product Dependency Discovery
AI Product under design
  → Searches for suitable Data Product inputs
  → Uses Product Graph to inspect lineage, quality, and policy constraints
  → Candidate inputs are passed into PDEP for governed product design
28. Summary
The Product Graph Navigation Zone is the PVEP zone that makes product relationships visible, navigable, and actionable across the ProductVerse.
It allows consumers and agents to explore:
- dependencies,
- lineage,
- provenance,
- substitutes,
- complements,
- bundles,
- product chains,
- product ecosystems,
- policy relationships,
- entitlement relationships,
- trust relationships,
- product-to-product consumption patterns.
It turns the ProductVerse from a flat catalog into a navigable product topology.
The essential principles are:
- Product relationships are first-class.
- The ProductVerse may be projected through many topology views.
- Graph navigation should be focused, explainable, and action-oriented.
- Relationship data must be trustworthy, governed, and access-controlled.
- Graph views should connect to marketplace, consumption, trust, portfolio, product selection, and PDEP transition flows.
- Product graph navigation may reveal creation opportunities, but PDEP builds governed products.
In short:
The Product Graph Navigation Zone makes the connected structure of the ProductVerse visible and actionable, while preserving the boundary that governed product creation belongs to PDEP.